
Guest blog by Dr. Jeremy Roschelle, Digital Promise, @roschelle63
Summary: When integrated with curriculum and pedagogy, visual representations that change in time can improve students’ conceptual understanding of mathematics.
To understand mathematics, students need to connect ideas.
For example, the slope of a line is often given as a number — the m in y = mx + b. We can measure the slope with triangles of “rise over run” drawn anywhere and at any size along a straight line in a graph. Why does the measure of rise over run always come out the same?
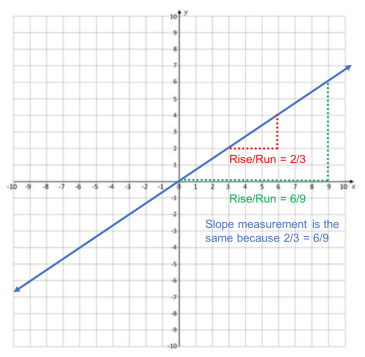
A student can measure rise over run at any pair of points along a line.
The ratio—the slope—will always come out the same. Why?
Fundamentally, slope is connected to concepts of geometric similarity and ratio — m always comes out the same because it is a measure of the ratio of the sides of
View original post 1,903 more words
